

Image Details
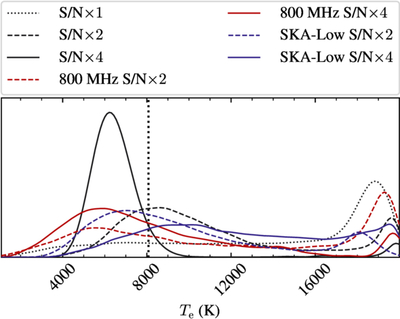
Caption: Figure 8.
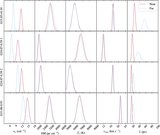
Effects of increasing the S/N of one or all measurements in the posterior distribution for Te. The dotted line shows the base case, with an S/N comparable to that of the observations presented in this work. The black dashed and solid lines show the effect of increasing the S/N of all measurements by factors of 2 and 4, respectively. The red dashed and solid lines show the effect of increasing the S/N of the measurements at 800 MHz by factors of 2 and 4, respectively. The blue dashed and solid lines show the effect of including a measurement at 182 MHz with an S/N factor of 2 and 4 larger than that of the observations presented here, respectively.
Other Images in This Article
Copyright and Terms & Conditions
© 2026. The Author(s). Published by the American Astronomical Society.

