

Image Details
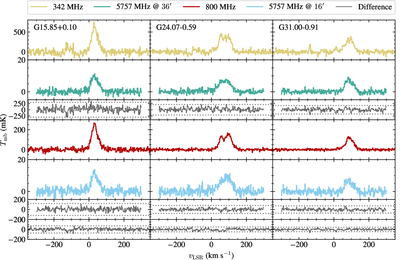
Caption: Figure 2.
RRL spectra toward G15.85+0.10 (left), G24.07−0.59 (center) and G31.00−0.91 (right). From top to bottom each rows shows the PF 342 MHz RRL spectra at ﹩36^{\prime} ﹩ resolution, the GDIGS spectra at ﹩36^{\prime} ﹩ resolution, the difference between the PF 342 MHz and GDIGS spectra at ﹩36^{\prime} ﹩ resolution, the PF 800 MHz RRL spectra at ﹩16^{\prime} ﹩ resolution, the GDIGS spectra at ﹩16^{\prime} ﹩ resolution, the difference between the PF 800 MHz and GDIGS spectra at ﹩16^{\prime} ﹩ resolution, and the difference between the PF 342 MHz and 800 MHz RRL spectra, at different resolutions. The dotted lines show the 3σ rms of the differences. To compute the differences between the HRRL spectra at different frequencies, the higher-frequency data have been scaled to match the peak of the lower-frequency data.
Other Images in This Article
Copyright and Terms & Conditions
© 2026. The Author(s). Published by the American Astronomical Society.

