

Image Details
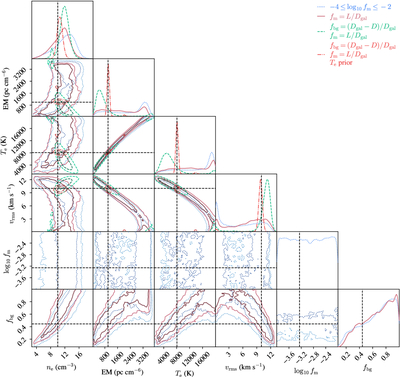
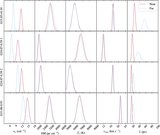
Caption: Figure 6.
Posterior probability distributions for the model parameters from the validation exercise. The vertical and horizontal lines show the input values used to generate the synthetic spectra: ne = 10 cm−3, Te = 8000 K, EM = 1000 pc cm−6, fbg = 0.44, and fm = 5.5 × 10⁻⁴. fm represents the fraction of the observed continuum that is nonthermal and comes from the same volume as the HRRLs. The blue dotted line shows the case where all model parameters are free, and fm can take values between 10−4 and 10−2; the dark red solid line shows the case where fm = L/Dgal; the green dashed line shows the case where fm = L/D and fbg = (Dgal − D)/Dgal; and the red dotted–dashed line shows the case where fm = L/D, fbg = (Dgal − D)/Dgal, and a Gaussian prior for the electron temperature is adopted.
Other Images in This Article
Copyright and Terms & Conditions
© 2026. The Author(s). Published by the American Astronomical Society.

