

Image Details
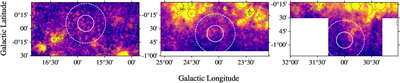
Caption: Figure 1.
Regions observed with the GBT. The background images are moment-0 maps from GDIGS. The white circles show the beam size of the GBT at the lowest frequency used for the 800 (solid) and 340 MHz (dashed) observations. The white circles are centered on the regions observed. The red, cyan, green, and yellow circles show known, candidate, group, and radio-quiet H II regions, respectively, from v.2.3 of the Wide-field Infrared Survey Explorer (WISE) catalog of H II regions (L. D. Anderson et al. 2014).
Other Images in This Article
Copyright and Terms & Conditions
© 2026. The Author(s). Published by the American Astronomical Society.

Copyright ©
2026 Astronomy Image Explorer. All Rights Reserved.
