Image Details
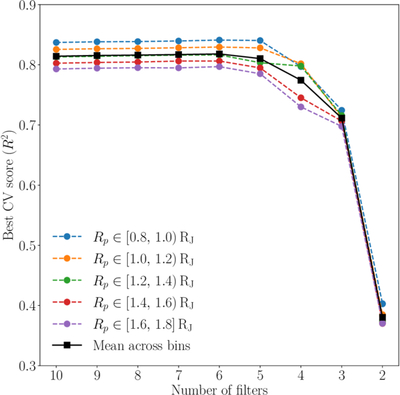
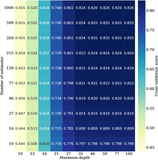
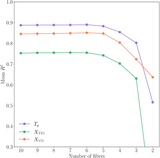
Caption: Figure 9.
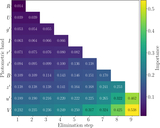
The cross-validation score as a function of the number of filters for each second-stage model associated with each Rp range. The scores correspond to the average predictive performance across the three atmospheric parameters: Tp, XTiO, and XVO. Note that the number of filters is reduced according to their importance. The dashed curves represent individual second-stage models, while the solid black curve shows their mean.
Other Images in This Article
Show More
Copyright and Terms & Conditions
© 2026. The Author(s). Published by the American Astronomical Society.
Copyright ©
2026 Astronomy Image Explorer. All Rights Reserved.