Image Details
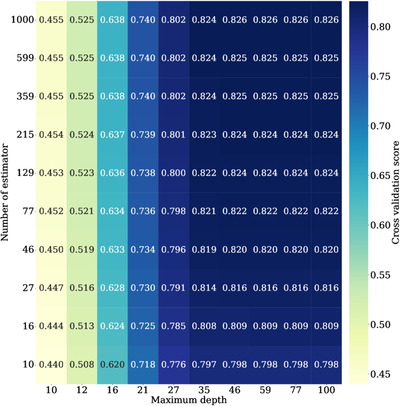
Caption: Figure 4.
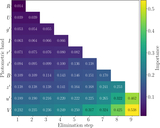
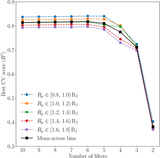
Example of the R2 scores obtained for each hyperparameter combination of the second-stage model with Rp ∈ [0.8, 1.0) RJ, where the y-axis is the number of estimators and the x-axis is the maximum depth. The color scale represents the mean R2 value across all predicted parameters, with darker colors indicating higher accuracy. The best-performing model in this grid has 1000 estimators and a maximum depth of 46, yielding an R2 = 0.826.
Other Images in This Article
Show More
Copyright and Terms & Conditions
© 2026. The Author(s). Published by the American Astronomical Society.
Copyright ©
2026 Astronomy Image Explorer. All Rights Reserved.