Image Details
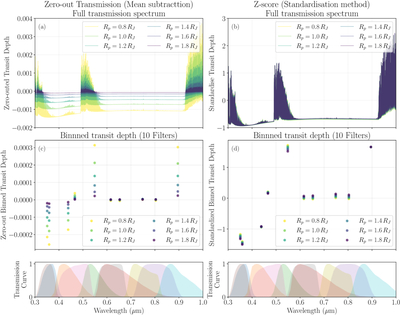
Caption: Figure 13.
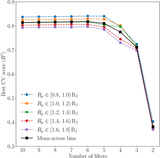
Comparison of normalization schemes: the commonly used zero-out (mean subtraction) approach versus our adopted z-score standardization. Panels (a) and (b) show the full synthetic transmission spectra, while panels (c) and (d) present the corresponding 10-band photometry. In all cases, the atmospheric parameters are fixed and only the planetary radius varies over Rp = 0.8–1.8RJ. We note that the transit depth is not directly comparable between methods due to different normalizations; therefore, we focus on relative spectral behavior, quantified via the residual variance as illustrated further in Figure 14.
Other Images in This Article
Show More
Copyright and Terms & Conditions
© 2026. The Author(s). Published by the American Astronomical Society.