Image Details
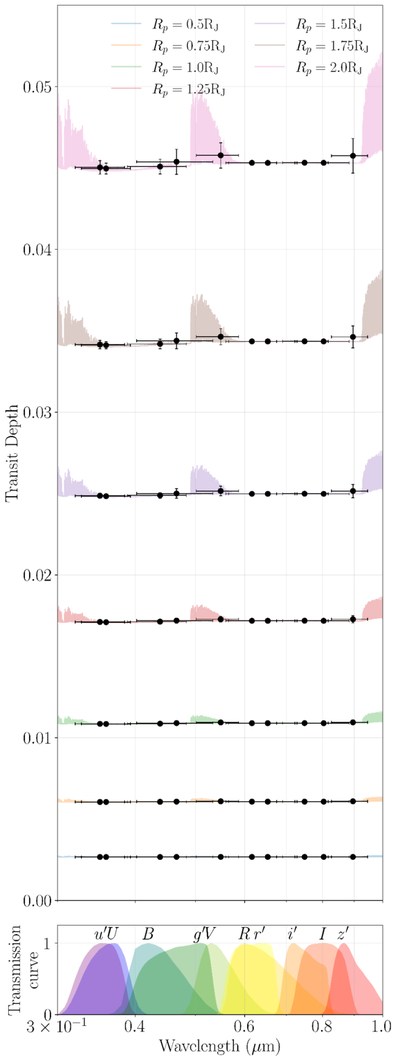
Caption: Figure 11.
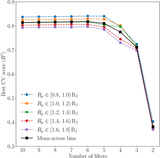
A comparison of synthetic transmission spectra generated using TauREx3 for six models with different planetary radii. The models shown range from Rp = 0.5 RJ (light blue) to Rp = 2.0 RJ (pink), as indicated in the legend. The faint, shaded lines represent the full-resolution spectra, while the black circles with error bars show the same spectra binned to the 10 optical filters used in this work. The models are plotted at their true transit depths, illustrating how both the continuum level and the amplitude of molecular features (primarily TiO and VO) increase with Rp.
Other Images in This Article
Show More
Copyright and Terms & Conditions
© 2026. The Author(s). Published by the American Astronomical Society.
Copyright ©
2026 Astronomy Image Explorer. All Rights Reserved.