Image Details
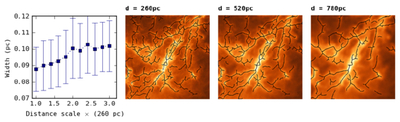
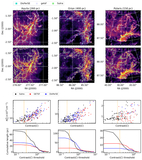
Caption: Figure 17.
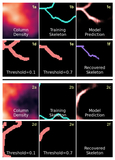
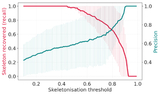
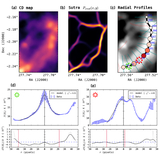
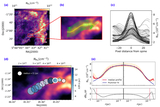
Resolution degradation test using effective distance scaling. Left: median beam-level filament width across as a function of distance (scaled relative to 260 pc), with error bars indicating dispersion across the sample. Right: example CD maps and corresponding filament skeletons extracted by Sutra at three representative distances (260, 520, and 780 pc). The results show that the derived filament widths remain consistent within expected beam-smearing effects, with a gradual increase at larger distances due to resolution degradation.
Other Images in This Article
Show More
Copyright and Terms & Conditions
© 2026. The Author(s). Published by the American Astronomical Society.
Copyright ©
2026 Astronomy Image Explorer. All Rights Reserved.