Image Details
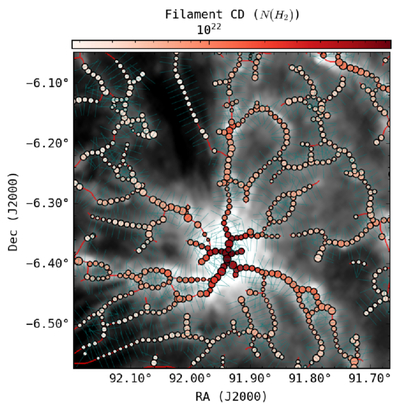
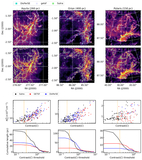
Caption: Figure 11.
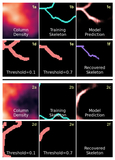
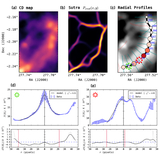
Example of filament property extraction using Sutra on the Mon R2 region. The filament skeleton map is shown over the CD map. Variation of filament density is shown with a red color map. The radius of beam elements shows the width of filament (﹩{R}_{bg}^{+}+{R}_{bg}^{-}﹩).
Other Images in This Article
Show More
Copyright and Terms & Conditions
© 2026. The Author(s). Published by the American Astronomical Society.
Copyright ©
2026 Astronomy Image Explorer. All Rights Reserved.