Image Details
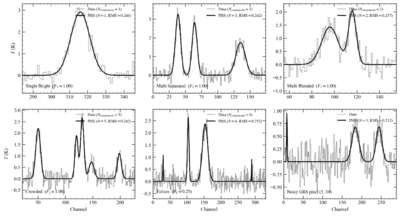
Caption: Figure 4.
Representative PHSPECTRA decompositions at β = 3.5. Each panel shows the data (gray step) and the summed PHSPECTRA fit (solid black) with the recovered component count N and residual rms in its legend. For the synthetic panels, the data legend also reports the true number of Gaussian components Ncomponents, and the F1 score against the full ground-truth parameters is annotated in the lower-left corner. Five panels are drawn from the synthetic benchmark categories of Table 1—single bright (SB), multiseparated (MS), multiblended (MB), and crowded (C)—with the failure panel selected as the lowest-F1 case in a 50-spectrum MB+C scan. The final panel is a noisy real GRS sight line (no ground truth) chosen to lie in the high-residual regime of Section 3.3.
Other Images in This Article
Copyright and Terms & Conditions
© 2026. The Author(s). Published by the American Astronomical Society.