Image Details
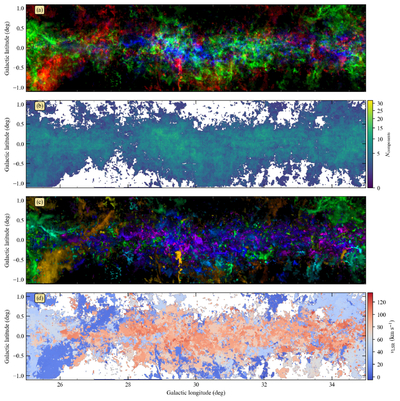
Caption: Figure 6.
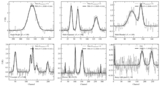
Survey-scale products derived from the decomposition (GRS tiles 26–34, ℓ ≈ 25°–35°). All maps are at the GRS native pixel scale of 22″. (a) Velocity RGB composite: components are binned by centroid velocity into three contiguous intervals [−5.0, 41.7], [41.7, 88.3], and [88.3, 134.9] km s−1 mapped to R, G, B respectively; per-channel intensities are clipped to the 99th percentile. (b) Topological complexity: number of Gaussian components per pixel, displayed on a square-root color scale to separate the dense-tile core from the diffuse background. (c) Amplitude–velocity bivariate colormap: hue encodes the centroid velocity of the brightest component (over the recovered range [−5.0, 134.9] km s−1) and luminance encodes its peak amplitude linearly, clipped to the 99th-percentile value of 3.0 K. (d) Dominant velocity field: centroid velocity of the brightest component per pixel.
Other Images in This Article
Copyright and Terms & Conditions
© 2026. The Author(s). Published by the American Astronomical Society.