Image Details
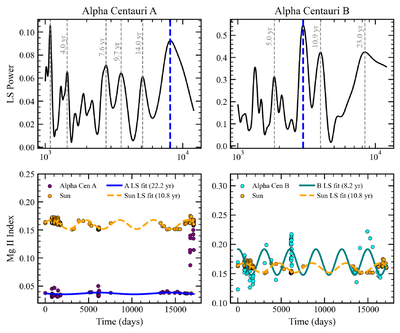
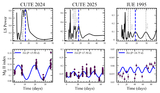
Caption: Figure 6.
Top: these panels present the Lomb–Scargle power for different activity cycle power frequencies found in the datasets of Alpha Centauri A and B. The highest power for a period >5 yr is marked by the blue dashed line, which amounts to 22.2 yr for Alpha Centauri A and 8.2 yr for Alpha Centauri B. Bottom: these panels present the sinusoidal fit to the Mg II index data for Alpha Centauri A and B. The solar Mg II index is overlaid in the figure for reference. The solar Mg II index is obtained from the LASP Interactive Solar Irradiance Datacenter (LISIRD) website (H. Leise et al. 2019).
Other Images in This Article
Copyright and Terms & Conditions
© 2026. The Author(s). Published by the American Astronomical Society.
Copyright ©
2026 Astronomy Image Explorer. All Rights Reserved.