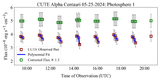
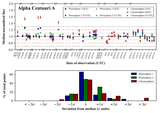
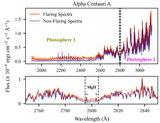
Image Details
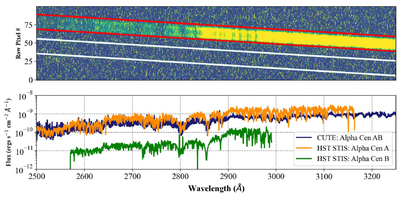
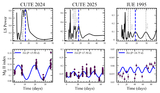
Caption: Figure 1.
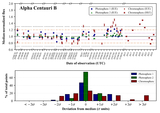
Top: CUTE NUV 2D CCD spectra of Alpha Centauri from a single 240 s exposure. The spectral extraction region is marked by the red parallel lines and the background extraction region is marked by the white parallel lines. Bottom: 1D background-corrected spectra obtained by summing the counts from the columns in the spectral extraction region and converted into stellar flux units by multiplying with CUTE’s wavelength-dependent sensitivity curve. HST spectra of Alpha Centauri A and B are also plotted as a reference for CUTE’s observed flux. The resolution of the HST spectra has been reduced to match CUTE’s resolution via convolution with a Gaussian kernel, enabling a direct comparison of the absorption features with the CUTE data.
Other Images in This Article
Copyright and Terms & Conditions
© 2026. The Author(s). Published by the American Astronomical Society.