Image Details
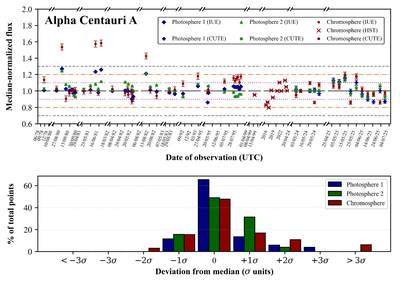
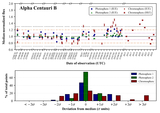
Caption: Figure 3.
The top panel presents the photosphere 1, chromosphere, and photosphere 2 intensity variation of Alpha Centauri A. The x-axis represents the date of observation in dd-mm-yy, mm-yy, or yyyy format. The dotted purple line represents the ±1σ cutoff, the orange dotted–dashed line the ±2σ point, and the gray dashed line the ±3σ cutoff point. The red points above the +3σ line are chromospheric flaring events detected at Alpha Centauri A. The bottom panel represents the distribution of the photosphere 1, chromosphere, and photosphere 2 points around the median from CUTE, HST, and IUE. The flaring events are captured by the far right bar above the 3σ level.
Other Images in This Article
Copyright and Terms & Conditions
© 2026. The Author(s). Published by the American Astronomical Society.