Image Details
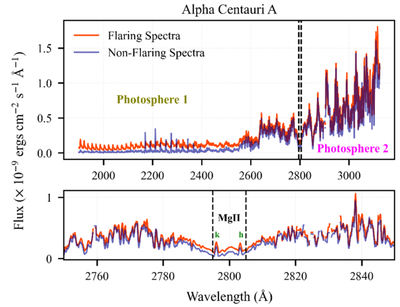
Caption: Figure 4.
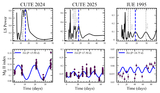
The top panel compares a flaring spectrum vs. a normal spectrum of Alpha Centauri A as observed by IUE. The difference in flux is more noticeable in the shorter-wavelength regime labeled as photosphere 1. The bottom panel zooms in on the region marked by the dashed lines in the top plot containing the Mg II h and k lines, which are proxies for chromospheric activity in the star. During a flare the intensities of the h and k lines also increase.
Other Images in This Article
Copyright and Terms & Conditions
© 2026. The Author(s). Published by the American Astronomical Society.
Copyright ©
2026 Astronomy Image Explorer. All Rights Reserved.