Image Details
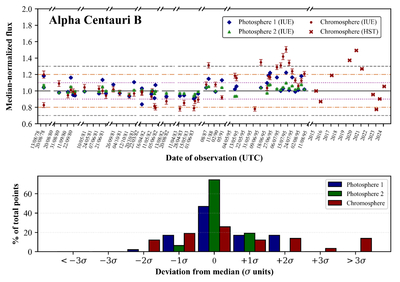
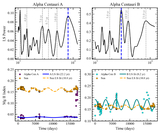
Caption: Figure 5.
The top panel presents the photosphere 1, chromosphere, and photosphere 2 intensity variation of Alpha Centauri B. The x-axis represents the date of observation in dd-mm-yy, mm-yy, or yyyy format. The dotted purple line represents the ±1σ cutoff, the orange dotted–dashed line the ±2σ point, and the gray dashed line the ±3σ cutoff point. The bottom panel represents the distribution of the photosphere 1, chromosphere, and photosphere 2 points around the median from HST and IUE.
Other Images in This Article
Copyright and Terms & Conditions
© 2026. The Author(s). Published by the American Astronomical Society.
Copyright ©
2026 Astronomy Image Explorer. All Rights Reserved.