Image Details
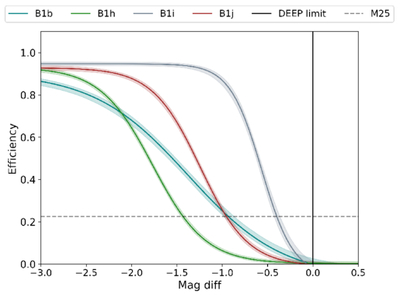
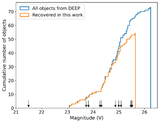
Caption: Figure 7.
Detection efficiency as a function of magnitude difference relative to the DEEP survey limit for each analyzed FN. Colored curves show the recovery efficiency obtained with our method, while the shaded regions indicate the associated uncertainties. The black vertical line at Δm = 0 marks the nominal DEEP detection limit reported by K. J. Napier et al. (2024). The horizontal dashed line denotes the 25% recovery efficiency threshold. Offsets to the left of the vertical line correspond to brighter sources, and the displacement of each curve relative to this reference illustrates how much shallower each FN is compared to the DEEP survey.
Other Images in This Article
Copyright and Terms & Conditions
© 2026. The Author(s). Published by the American Astronomical Society.