Image Details
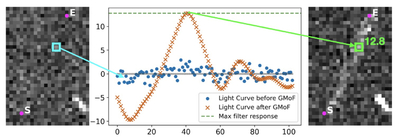
Caption: Figure 3.
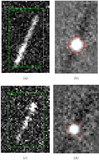
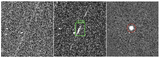
Comparison of two image-combination statistics applied to a planted moving object of magnitude m = 25.06. The left panel shows the coadded image, with a blue box indicating the pixel used to extract the light curve. The central panel presents the single-pixel light curve before (blue points) and after (vermilion crosses) applying the GMoF (Section 3.1). The dashed green line marks the maximum filter response. The labels “S” and “E” indicate the start and end of the object’s streak across the pixel. After applying the GMoF, the enhanced signal traces the object’s passage through the pixel, producing a clear peak. The final combined image, constructed by selecting the maximum value of the filtered light curve, is shown in the right panel, where the object is recovered with enhanced significance.
Other Images in This Article
Copyright and Terms & Conditions
© 2026. The Author(s). Published by the American Astronomical Society.