Image Details
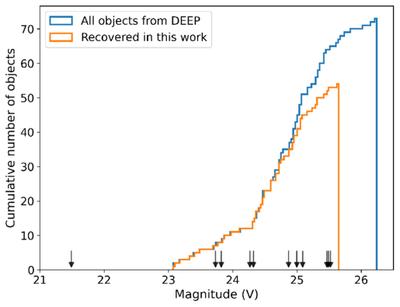
Caption: Figure 8.
Cumulative magnitude distribution of TNOs in the analyzed DEEP survey fields shown in Figure 1. The blue step curve shows all TNOs reported by the DEEP survey (H. Smotherman et al. 2024), while the orange step curve shows the subset of those objects recovered by our pipeline. Downward-pointing arrows mark the calibrated magnitudes of newly discovered TNOs identified by our method that were not reported in the DEEP catalog; magnitudes are computed using the photometric calibration described in Section 5.2.
Other Images in This Article
Copyright and Terms & Conditions
© 2026. The Author(s). Published by the American Astronomical Society.
Copyright ©
2026 Astronomy Image Explorer. All Rights Reserved.