Image Details
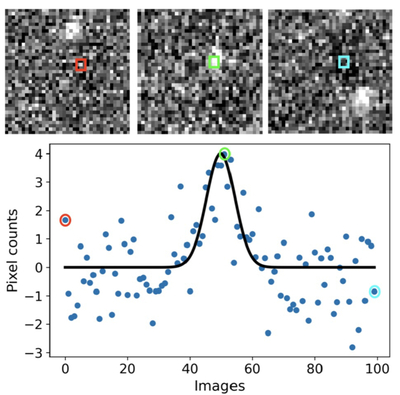
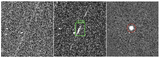
Caption: Figure 2.
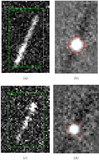
Upper panels show a synthetic moving object at three representative epochs (image indices 0, 50, and 99) as it traverses the image sequence. The colored boxes indicate the same detector pixel sampled at each epoch, whose values contribute to the light curve shown below. The lower panel displays the resulting single-pixel light curve, with pixel counts plotted as a function of image index. Blue points represent the full time series of pixel values, while the red, green, and cyan circled points correspond to the epochs highlighted in the upper panels. The black curve shows the expected theoretical response for a moving point source, yielding an approximately Gaussian-shaped signal as the object passes through the pixel.
Other Images in This Article
Copyright and Terms & Conditions
© 2026. The Author(s). Published by the American Astronomical Society.