Image Details
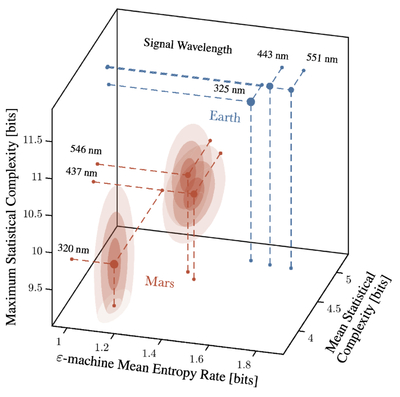
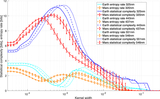
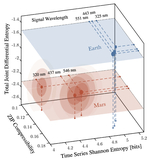
Caption: Figure 9.
Results from computational mechanics analysis of Earth and Mars reflectance time series at three different wavelengths. Metrics shown are (a) mean statistical complexity on the x-axis, (b) mean epsilon-machine entropy rate on the y-axis, and (c) maximum statistical complexity (as a function of kernel width) on the z-axis. Horizontal and vertical lines are plotted emanating from each point to aid visualization. Ellipsoids emanating from Mars data points correspond to the respective uncertainties (Earth uncertainties were found to be negligible, see Section 2.3 for details).
Other Images in This Article
Copyright and Terms & Conditions
© 2026. The Author(s). Published by the American Astronomical Society.
Copyright ©
2026 Astronomy Image Explorer. All Rights Reserved.