Image Details
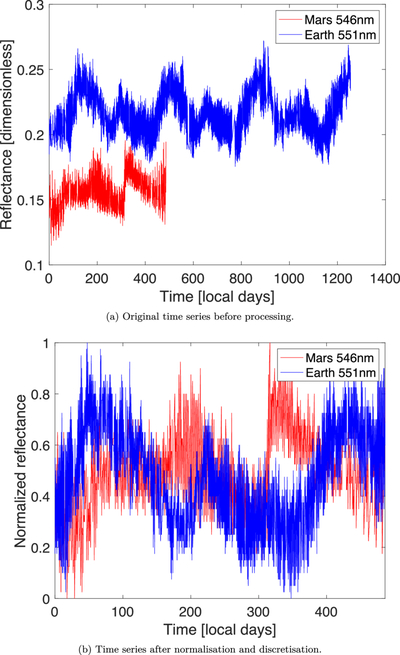
Caption: Figure 6.
Example time series used in our analysis. The top panel shows the original data for Earth at 551 nm and Mars at 546 nm. Note the different overall lengths (sampling rates are also different, with Earth having a slightly higher rate). The lower panel shows the same time series after normalization, truncation of the Mars series, and resampling to the same, equally spaced time index.
Other Images in This Article
Copyright and Terms & Conditions
© 2026. The Author(s). Published by the American Astronomical Society.
Copyright ©
2026 Astronomy Image Explorer. All Rights Reserved.