Image Details
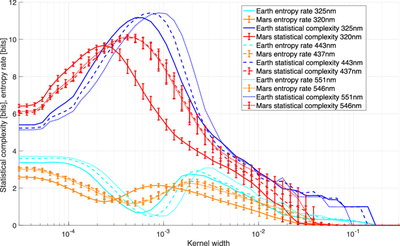
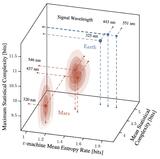
Caption: Figure 7.
Statistical complexity and entropy rate curves over kernel width parameter values. Earth complexities are shown in blue and entropy rates in cyan. Mars complexities are shown in red and entropy rates in orange. Solid lines correspond to wavelengths ∼322 nm, dashed lines to ∼440 nm, and dotted lines to wavelengths ∼550 nm. Error bars are shown for Mars metrics but not Earth since Earth uncertainties were found to be negligible.
Other Images in This Article
Copyright and Terms & Conditions
© 2026. The Author(s). Published by the American Astronomical Society.
Copyright ©
2026 Astronomy Image Explorer. All Rights Reserved.