Image Details
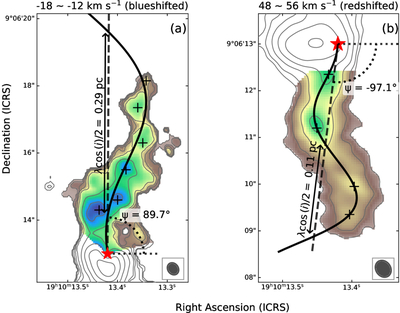
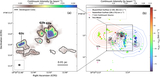
Caption: Figure 4.
Panel (a): wiggle fitting of outflow lobe “Bn”. The color scale shows the integrated intensity within the region selected for fitting, overlaid on the full moment 0 contours. The region near the source was removed to avoid contamination from the compact outflow lobe with high inclination angle. The red star represents source G2a, consistent with that in Figure 1. The black solid line shows the outflow trajectory, and the dashed line represents the precession axis. The position angle of axis and projected half precession length scale are marked in the figure. Panel (b): wiggle fitting of lobe “Rs”.
Other Images in This Article
Copyright and Terms & Conditions
© 2026. The Author(s). Published by the American Astronomical Society.
Copyright ©
2026 Astronomy Image Explorer. All Rights Reserved.