Image Details
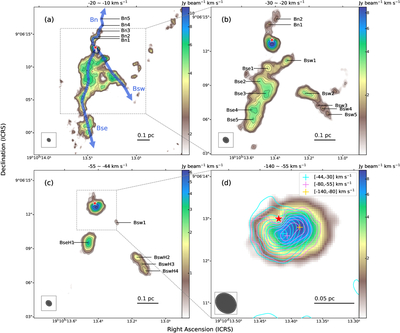
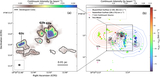
Caption: Figure 1.
Moment 0 maps of blueshifted 12CO emission in four velocity channels, shown in both color scales and superimposed contours. Panels (a), (b), (c), and (d) correspond to low-, medium-, high-, and extremely high-velocity channels. The levels of black contours are [7, 9, 11, 14, 17, 20, 24, 30, 42, 55] times the rms noise for panel (a) and (b), and [7, 10, 15.5, 24, 32, 45, 60, 75] for panel (c), where the rms in each panel is estimated from background regions in the corresponding channel. Beams and the scale bars are shown in the bottom left and right corners, respectively. In panel (a), (b) and (c), distinct knots are labeled following "B" for blueshifted + direction + "H" for high-velocity in panel (c) + number in order of distance from the central source for a given direction. The red star marks the location of the central protostar, determined from the peak of the continuum emission. Four outflow lobes are illustrated by four blue arrows in panel (a). The short white arrow with a dark blue edge represents the previously studied outflow lobe nearly along the line of sight (T. Liu et al. 2015). Panel (d) shows contours and emission peaks (plus signs) of the inner region from diverse channels. The extremely high-velocity component is divided into [−80, −56] and [−140, −80] km s−1 to show the velocity-dependent spatial distribution. Note that the emission peak tends to move outward as velocity increases.
Other Images in This Article
Copyright and Terms & Conditions
© 2026. The Author(s). Published by the American Astronomical Society.