Image Details
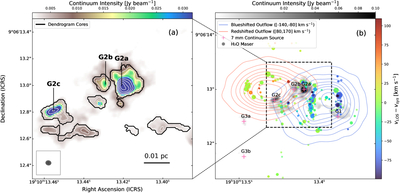
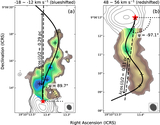
Caption: Figure 5.
Panel (a): a zoom-in view of the high-resolution 1.3 mm continuum emission from the ALMA archival data surrounding the sources G2a, G2b, and G2c, corresponding to the region marked by the dashed black box in the right panel. The thick black contours with labels outline the core boundaries identified by the astrodendro algorithm. The white contours represent the continuum emission levels at [5, 10, 15, 20, 30, 50, 80, 120, 180, 250] times the continuum rms noise (5.3 × 10⁻⁴ Jy beam−1). Panel (b): water maser spotmap (data from B. Zhang et al. 2013) overlaid on moment 0 contours of extremely high-velocity bipolar outflow. The background is the high-resolution 1.3 mm continuum map on the center of W49N. The pink crosses represent 7 mm continuum objects observed in C. G. De Pree et al. (2020). Blue and red contours represent outflows with channel velocities of [-140,-80] and [80,170] km s−1 (consistent with the color maps in Figures 1(d) and 2(d)), and the contour levels are [15,25,35,45,55,65,77,90,105] times the rms noises for redshifted and blueshifted moment-0 map, respectively. The spot sizes show the intensity of water maser emission and colors represent LOS relative velocity.
Other Images in This Article
Copyright and Terms & Conditions
© 2026. The Author(s). Published by the American Astronomical Society.