Image Details
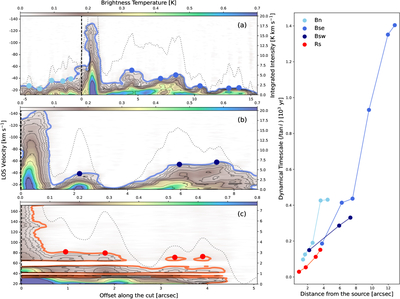
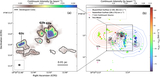
Caption: Figure 3.
Left: PV diagrams of 12CO emission. The PV cuts of panels (a), (b), and (c) are along the connection of the two curved arrows “Bn” and “Bse”, the curved arrow “Bsw” in Figure 1 panel (a), and “Rs” in Figure 2 panel (a), respectively. Low velocity (less than ∼10 km s−1 relative to the systemic velocity) parts are chopped out. The black dashed vertical lines indicate the position of source G2a. The smoothed contours in blue and red indicate 10 times the rms value of the PV diagram background. The colored dots on the smoothed contour denote the knots in four different newly found outflow lobes, which can be distinctly recognized by eye with the assistance of the gray-dotted integrated intensity curve. The intensity of the curve in panel (c) is integrated from the velocity channels higher than 40 km s−1 only to avoid contamination. Right: dynamical timescale for each knot without inclination angle correction. The x-axis represents distance between each knot and the source.
Other Images in This Article
Copyright and Terms & Conditions
© 2026. The Author(s). Published by the American Astronomical Society.