Image Details
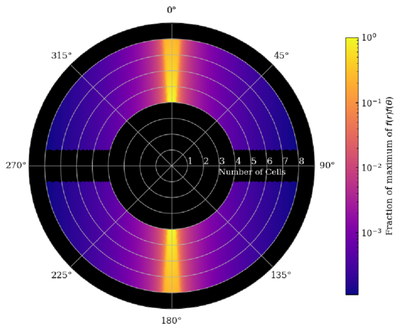
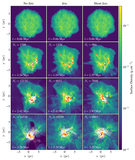
Caption: Figure 14.
Figure 2 but with a fixed ﹩{\rm{\Delta }}\theta =\arctan (1/8)﹩ as in A. J. Cunningham et al. (2011). This is the injection region produced by the version of the Torch code identified by the jets-v1.2 tag or newer and is recommended for future studies using Torch with jets. The heatmap shows the relative value (as a fraction of the maximum value) of the product of the radial and angular dependence: f(r)g(θ). The actual weighting for each cell of the injection region is the product of this quantity evaluated at the cell center and the geometric factor determining the overlap of the injection region and the specific cell, and is normalized such that all the weights add to 1. Neither this normalization nor the geometric factor is included in this plot, in order to focus on the distribution of the f(r)g(θ) factor. Regions shaded black are outside the injection region and have a weighting of 0.
Other Images in This Article
Show More
Copyright and Terms & Conditions
© 2026. The Author(s). Published by the American Astronomical Society.