Image Details
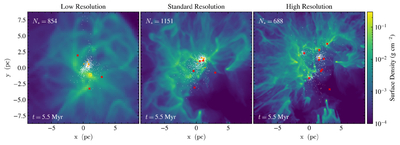
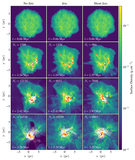
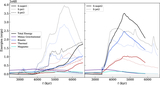
Caption: Figure 12.
Projection plots of density along the z-axis are shown for three runs with varying maximum refinements: S-lowres, S-jet1, and S-hires. All runs include jets with the default values for the jet parameters, as in S-jet1. The x-y position of each star particle is shown as a white dot for nonfeedback stars and an orange star for any star injecting either winds or jets. Sink particles are shown as red Y symbols. The number of star particles is shown on each panel. For these runs, tff = 2.2 Myr, so the plotted time corresponds to approximately 2.5 tff.
Other Images in This Article

Show More
Copyright and Terms & Conditions
© 2026. The Author(s). Published by the American Astronomical Society.
Copyright ©
2026 Astronomy Image Explorer. All Rights Reserved.