Image Details
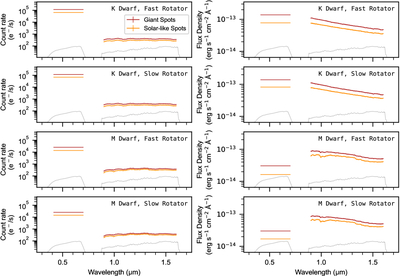
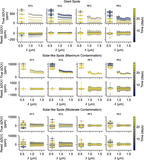
Caption: Figure 2.
Representative simulated Pandora spectra for each stellar scenario. Each row corresponds to a stellar scenario, while the left and right columns show count rate and flux density, respectively. In each panel, a representative 12 hr binned spectrum is shown for both giant-spot (red) and solar-like spot (orange) morphologies. Vertical error bars, which are generally smaller than the line width, denote 12 hr measurement uncertainties. The dotted black curves indicate the sensitivity of the VISDA and NIRDA instruments, shown on an arbitrary scale.
Other Images in This Article
Copyright and Terms & Conditions
© 2026. The Author(s). Published by the American Astronomical Society.
Copyright ©
2026 Astronomy Image Explorer. All Rights Reserved.