Image Details
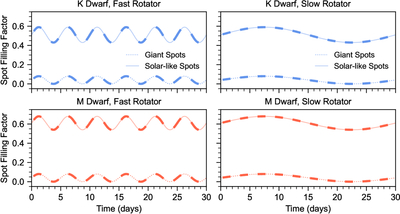
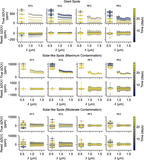
Caption: Figure 1.
Simulated time-dependent spot filling factors for each stellar scenario. Each panel shows sinusoidal variations in the projected spot filling factor over a full 30-day observing window, using the adopted stellar rotation period (5 days or 30 days) and the ﹩{f}_{{\rm{\min }}}﹩ and ﹩{f}_{{\rm{\max }}}﹩ values from Table 2. Thicker line segments show the times of the simulated Pandora observations.
Other Images in This Article
Copyright and Terms & Conditions
© 2026. The Author(s). Published by the American Astronomical Society.
Copyright ©
2026 Astronomy Image Explorer. All Rights Reserved.