Image Details
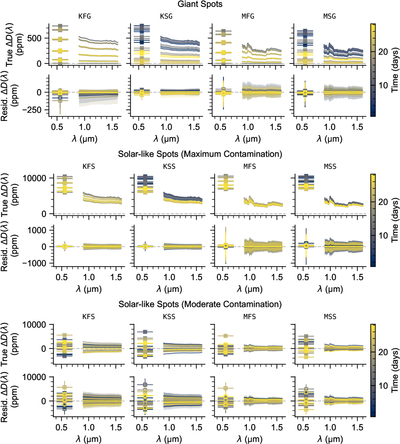
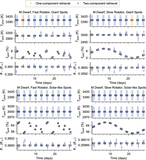
Caption: Figure 5.
True and residual stellar contamination signals for the spot prescriptions we consider: giant spots (top), solar-like spots with maximum contamination (middle), and solar-like spots with moderate contamination (bottom). In each row, columns correspond to the four related scenarios (see Table 1). Upper subpanels show the true contamination signal, ΔD(λ), across the VISDA bandpass (points with horizontal error bars) and the NIRDA wavelength range (curves). All 20 epochs are shown, and colors encode the epoch time. Lower subpanels show the residual contamination, ΔDresid(λ), remaining after applying the inferred correction, with shaded regions indicating the propagated uncertainty from the stellar retrieval posteriors.
Other Images in This Article
Copyright and Terms & Conditions
© 2026. The Author(s). Published by the American Astronomical Society.