Image Details
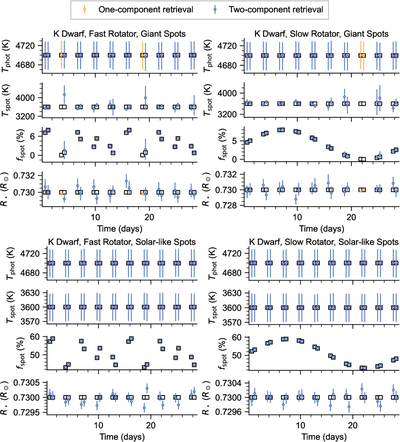
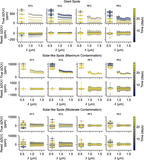
Caption: Figure 3.
Time series of inferred stellar parameters from fits to simulated Pandora observations of K-dwarf targets under four variability scenarios. The panels show the recovered photospheric temperature (Tphot), spot temperature (Tspot), spot filling factor (fspot), and stellar radius (R⋆) as a function of time. Each point corresponds to a pre- or post-transit stellar spectrum from an individual 24 hr visit. Black boxes indicate the input (true) parameter values. Blue points show the posterior means from the two-component retrievals, with error bars denoting the 68% credible intervals. Orange points indicate datasets for which the one-component model is preferred, for which Tspot and fspot are not defined.
Other Images in This Article
Copyright and Terms & Conditions
© 2026. The Author(s). Published by the American Astronomical Society.