Image Details
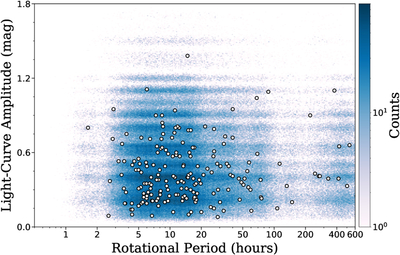
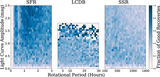
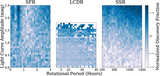
Caption: Figure 3.
Comparison of simulated and observed Hilda light-curve distributions. This shows a 2D histogram of rotational period versus light-curve amplitude for the combined simulated population, created by sampling from KDEs constructed using LCDB Hildas with measured rotational periods and/or light-curve amplitudes (223 objects total). White points indicate the subset of LCDB Hildas with both measured rotational periods and amplitudes (195 objects). Our KDE-based sample is consistent with the rotational properties of observed Hildas.
Other Images in This Article
Copyright and Terms & Conditions
© 2026. The Author(s). Published by the American Astronomical Society.
Copyright ©
2026 Astronomy Image Explorer. All Rights Reserved.