Image Details
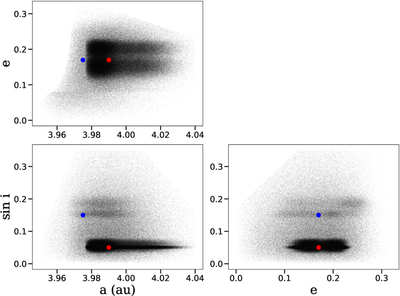
Caption: Figure 2.
Distribution of our 485,807 simulated Hildas projected onto 2D planes of their proper orbital parameters. (i) (a), (e) top left; (ii) (a, ﹩\sin (i)﹩) bottom left; and (iii) (e, ﹩\sin (i)﹩) bottom right. Each dark point represents an object from our simulated Hilda population. Approximate locations of the two largest collisional families associated with (153) Hilda (blue marker) and (1911) Schubart (red marker) are indicated for reference (D. Vokrouhlický et al. 2025).
Other Images in This Article
Copyright and Terms & Conditions
© 2026. The Author(s). Published by the American Astronomical Society.
Copyright ©
2026 Astronomy Image Explorer. All Rights Reserved.