Image Details
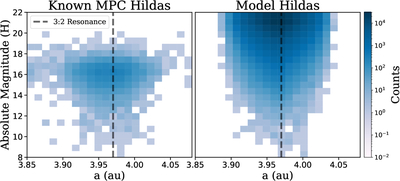
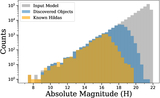
Caption: Figure 1.
Comparison of the known Hilda population from the MPC (left) and our synthetic Hilda population (right) in semimajor axis (a) and absolute magnitude (H). The vertical line at a = 3.971 au marks the location of the 3:2 mean-motion resonance with Jupiter, which defines the Hilda population. Our input sample reproduces the observed distribution in both a and H while extending to fainter magnitudes beyond the MPC limit.
Other Images in This Article
Copyright and Terms & Conditions
© 2026. The Author(s). Published by the American Astronomical Society.
Copyright ©
2026 Astronomy Image Explorer. All Rights Reserved.