Image Details
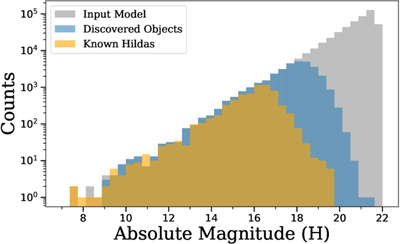
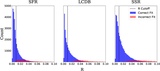
Caption: Figure 5.
Comparison of absolute magnitude (H) distributions for the known, input, and discovered Hilda populations. The orange histogram shows the currently known Hildas from the MPC. The blue distribution represents the Hildas discovered in our simulated survey with the gray being the full input population. The synthetic discoveries extend ∼1.5–2 magnitudes fainter than the known population, demonstrating LSST’s ability to probe substantially deeper and expand the observed Hilda population beyond current detection limits.
Other Images in This Article
Copyright and Terms & Conditions
© 2026. The Author(s). Published by the American Astronomical Society.
Copyright ©
2026 Astronomy Image Explorer. All Rights Reserved.