

Image Details
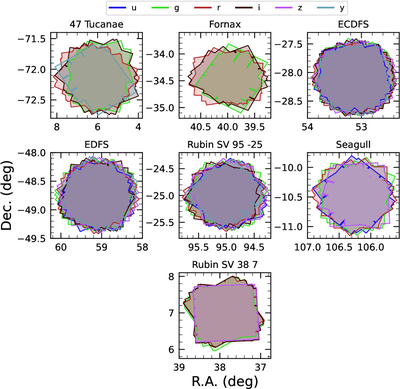
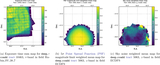
Caption: Figure 6.
Sky coverage maps showing the distribution of visits in each field, color coded by band. The images clearly show the focal plane chip gaps and dithering pattern. Only the detectors for which single-frame processing succeeded are included in the plots, which explains why the central region of 47_Tuc looks thinner than the other fields.
Other Images in This Article
Show More
Copyright and Terms & Conditions
© 2026. The Author(s). Published by the American Astronomical Society.

Copyright ©
2026 Astronomy Image Explorer. All Rights Reserved.
