

Image Details
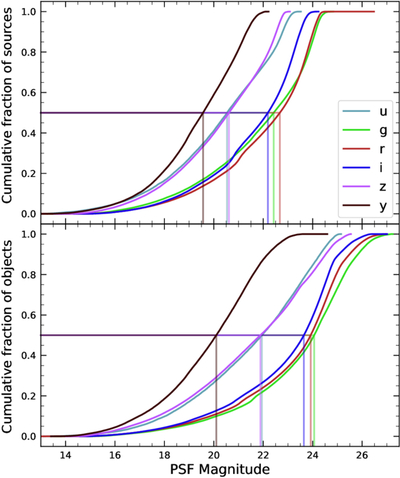
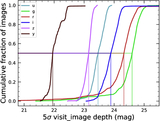
Caption: Figure 9.
Normalized cumulative histograms of the PSF magnitudes of all >5σ detected sources (top panel) and objects (bottom panel) contained in the Source and Object catalogs, respectively, separated according to band (see legend). The vertical lines indicate the 50th percentile for each band.
Other Images in This Article

Show More
Copyright and Terms & Conditions
© 2026. The Author(s). Published by the American Astronomical Society.

Copyright ©
2026 Astronomy Image Explorer. All Rights Reserved.
