Image Details
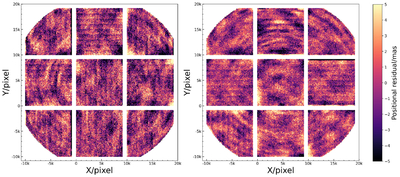
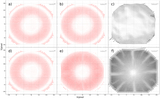
Caption: Figure 8.
Stacked maps of positional residuals for each CCD after GD modeling. The left panel shows the mean residual in the X-direction, while the right panel shows the mean residual in the Y-direction. Each pixel represents the mean positional residual averaged within a 100 × 100 pixel bin in the local CCD coordinate system.
Other Images in This Article
Show More
Copyright and Terms & Conditions
© 2026. The Author(s). Published by the American Astronomical Society.
Copyright ©
2026 Astronomy Image Explorer. All Rights Reserved.