Image Details
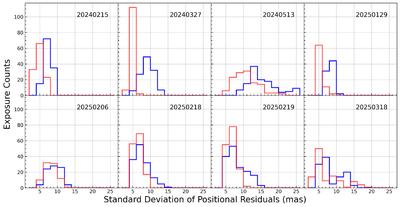
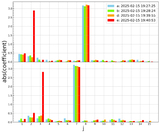
Caption: Figure 7.
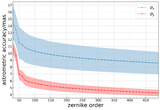
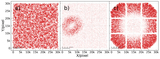
Histograms of the standard deviations of GD-corrected residuals for all exposures within a single night. The blue bars represent the standard deviations along the X-axis, while the red bars represent those along the Y-axis.
Other Images in This Article
Show More
Copyright and Terms & Conditions
© 2026. The Author(s). Published by the American Astronomical Society.
Copyright ©
2026 Astronomy Image Explorer. All Rights Reserved.