Image Details
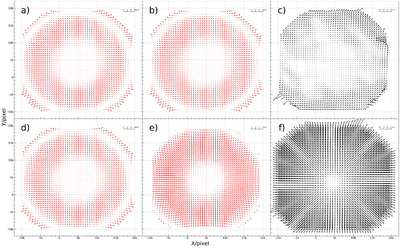
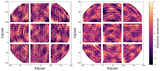
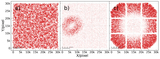
Caption: Figure 5.
Global GD models and their difference maps for two pairs of consecutive exposures in the 2016HO3 field. Panels (a) and (b) show similar GD models in one pair of consecutive exposures, with panel (c) presenting their difference. Panels (d) and (e) display significantly different GD models in another pair of exposures, with panel (f) showing their difference.
Other Images in This Article
Show More
Copyright and Terms & Conditions
© 2026. The Author(s). Published by the American Astronomical Society.
Copyright ©
2026 Astronomy Image Explorer. All Rights Reserved.