Image Details
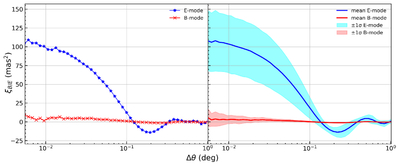
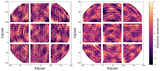
Caption: Figure 4.
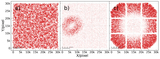
Typical E- and B-mode correlation functions. The left panel shows the correlation functions for the exposure corresponding to panel (c) of Figure 3, while the right panel shows the correlation functions averaged over all exposures in the 20250218 dataset. The solid curves denote the mean values, and the shaded regions indicate the 1σ scatter among the exposures.
Other Images in This Article
Show More
Copyright and Terms & Conditions
© 2026. The Author(s). Published by the American Astronomical Society.
Copyright ©
2026 Astronomy Image Explorer. All Rights Reserved.