Image Details
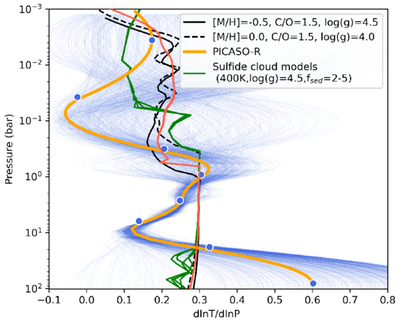
Caption: Figure 9.
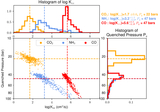
The temperature gradient (dlnT/dlnP) of the best-fit retrieval solution, which is plotted with the orange line, are subadiabatic (dlnT/dlnP < 0.3) in the 1–10 bar range, which could imply a low cooling rate at depth. See Section 4.3 for more detailed discussion. At P > ∼10 bar, the T-P profiles are not well constrained. The blue semitransparent lines show the temperature gradient calculated from 1000 T-P profiles randomly sampled from the retrieval posterior distribution. The blue dots are the T-P knots in the PICASO retrieval. For comparison, we also plot the T-P profiles of cloudless (black dashed and solid lines, Sonora Bobcat; M. S. Marley et al. 2021) and cloudy (green solid lines; C. V. Morley et al. 2012) forward model with an effective temperature of 400 K similar to WD 0806 b, but with different metallicity ([M/H] = [ −0.5, 0.0]), gravity (﹩\mathrm{log}(g)=[4.0,4.5]﹩), or sulfide cloud structures (fsed = [2, 3, 5]). Both cloudless and cloudy models show that the temperature gradients closely follow an adiabat (i.e., dlnT/dlnP ∼ 0.3) at pressures greater than 1 bar.
Other Images in This Article
Show More
Copyright and Terms & Conditions
© 2026. The Author(s). Published by the American Astronomical Society.