Image Details
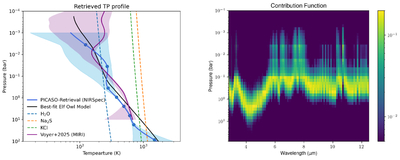
Caption: Figure 5.
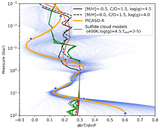
Left panel: the best-fit PICASO retrieval temperature–pressure (T-P) profile is plotted as a solid blue line with the temperature–pressure knots indicated in solid blue circles. The light-blue shaded region indicates the 3σ confidence interval of the retrieved T-P profiles. The tightly constrained T-P profiles in the 1–10 bar range match with the peak of the 3–5 μm contribution function plotted in the right panel. The retrieved T-P profile based on MIRI-LRS 5–11.7 μm spectrum in M. Voyer et al. (2025) is plotted in solid purple along with the 3σ uncertainty plotted as light-purple shaded region. The condensation curves of H2O, Na2S, and KCl at solar metallicity are plotted with blue, orange, and green dashed lines, respectively. For reference, the solid black line shows the T-P profile of the best-fit Elf Owl grid model ([M/H] = −1, C/O = 1.5, log(g) = 3.23, log(Kzz) = 7, Teff= 350 K). Right panel: the contribution function map of the best-fit PICASO retrieval results shows that most of the 3–5 μm flux is emitted from 0.1–10 bar region.
Other Images in This Article
Show More
Copyright and Terms & Conditions
© 2026. The Author(s). Published by the American Astronomical Society.