Image Details
Caption: Figure 2.
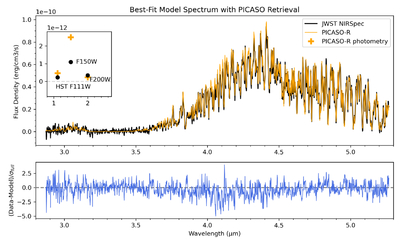
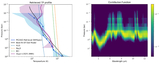
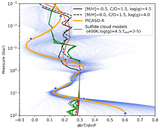
Top panel: the solid black and orange lines show the NIRSpec/G395M spectrum and the best-fit retrieval spectrum, respectively. The inset plot shows the JWST NIRCam F150W2, F200W, and the HST F110W broadband photometry, which are plotted in black dots. The integrated band photometry of the best-fit retrieval spectrum area is plotted with the orange plus signs. Bottom panel: the difference between the NIRSpec spectrum and the best-fit retrieval that is normalized by the full uncertainty (σfull), which includes NIRSpec/G395M data uncertainty and the two the marginalized uncertainty parameters described in Section 3.2.1.
(The data used to create this figure are available in the online article.)
(The data used to create this figure are available.)
Other Images in This Article
Show More
Copyright and Terms & Conditions
© 2026. The Author(s). Published by the American Astronomical Society.