Image Details
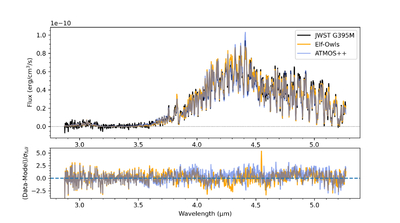
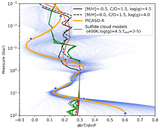
Caption: Figure 4.
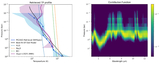
Top panel: the best-fit Elf-Owl (orange line) and ATMOS++ (blue line) model spectra compared to the JWST G395M spectrum (black line). Bottom panel: the residuals between the models and data normalized by the total uncertainties. The sharp positive residual feature at 4.55 μm of Elf-Owl model arises from the model CH4 opacity line list that includes CH3D at solar mixing ratio.
Other Images in This Article
Show More
Copyright and Terms & Conditions
© 2026. The Author(s). Published by the American Astronomical Society.
Copyright ©
2026 Astronomy Image Explorer. All Rights Reserved.