Image Details
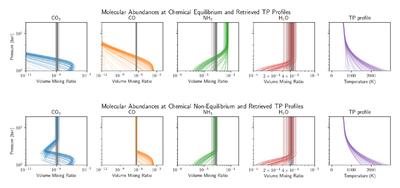
Caption: Figure 6.
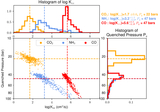
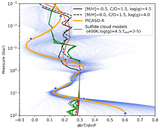
Top row: output from the chemical equilibrium models described in Section 3.5.1. Only 50 samples are plotted for clarity in this figure. Volume mixing ratios of CO2, CO, NH3, and H2O are shown as blue, orange, green, and red lines, respectively, based on 50 posterior samples from the PICASO retrievals. Gray vertical lines in the first four panels represent the retrieved mixing ratios for each molecule. The corresponding temperature–pressure (T-P) profiles are plotted as purple lines in the fifth panel. By identifying where the retrieved abundances (gray lines) intersect with the equilibrium curves (colored lines), we estimate the quench pressures. Bottom row: the same as the sampled profiles in the top row, except we have quenched each abundance profile where it intersects the vertically constant posterior abundance at quenched pressure Pquench. The samples with retrieved abundances greater than chemical equilibrium abundances (e.g., CO) are excluded in the bottom row because the quenched pressures cannot be estimated in these cases. Comparing the T-P profiles between top and bottom rows, the excluded samples mostly have cold T-P profiles and low CO chemical equilibrium abundances. The sharp inversion of the CO2 abundance near 50 bar is equivalent to the quenched CO pressure. See Section 3.5.1 for other details of the nonequilibrium models.
Other Images in This Article
Show More
Copyright and Terms & Conditions
© 2026. The Author(s). Published by the American Astronomical Society.