Image Details
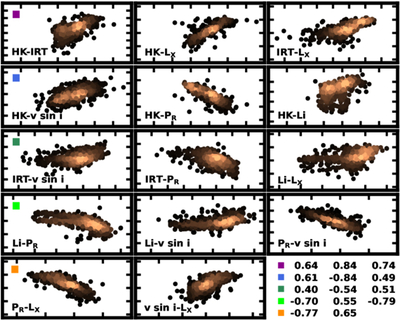
Caption: Figure 16.
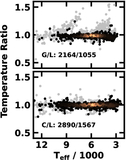
Correlations for 14 pairs of activity indices listed in Table 6 (not shown: RIRT–[Li/H], which has a negligible correlation coefficient). Text in the lower-left corner of each plot indicates the pair of indices; the x-axis (y-axis) plots the first (second) index listed. The lower-right corner lists the Spearman correlation coefficients from Table 6. For convenience, squares at the start of each row of coefficients correspond to squares in the upper-left corners of plots in the first column of the array of plots.
Other Images in This Article
Show More
Copyright and Terms & Conditions
© 2026. The Author(s). Published by the American Astronomical Society.
Copyright ©
2026 Astronomy Image Explorer. All Rights Reserved.